A brief History
It is said that the word Paombong could have been derived from the word bumbon which is one of the ancient methods of catching fish.
Another creative version concerns about the antiquated tuba container known as Bumbong. Bumbong is a long bamboo tube used for collecting Nipa sap. The practice of extracting nipa sap with bumbong made the town famous for its many bumbong The local people claimed that the Spaniards who first visited the place were amused by these bamboo bumbong so that they named the place after it which later became Paombong The natives pronounce the town’s name with silent a making it Pombong.
Population
55, 696
PSA 2020
71,419
BARANGAY SURVEY 2021
HOUSEHOLDS
11,782
PSA 2015
15,530
BARANGAY SURVEY 2021
SOCIO ECONOMIC PROFILE
Commerce and Trade
The major industries in Paombong include aquaculture (culturing milk fish, tilapia, shrimps, oysters, King Crab & others), ornamental plants/flowers used for gardening and landscaping, grass planting (carabao grass, bermuda grass, blue grass etc.), garments, and food processing (smoked fish and other food products) while the major products include condiments such as vinegar, fish sauce, and salts; nipa; and agricultural products such as rice, poultry, livestock, and fisheries. However, the business registrations do not reflect that the fishery and the processing of fishery products are the major industries. Instead, the service sector or those engaged in trading and other services has the lion’s share of the combined gross receipts at 86.13 percent. Meanwhile, about 13.07 percent is the contribution of the industry group, specifically construction and food processing and the remaining 0.80 percent is the share of the primary sector or the agriculture.
Water and Power Supply
- Water
The plan supports the utilization of surface water as alternative to groundwater extraction for its domestic water use. Since the domestic water requirement of Paombong is being served by the City of Malolos Water District and Hagonoy Water District, the Municipality is also supportive of the Bulacan Bulk Water Supply Project (BBWSP) where the source of treated water came from the surface water from the Angat Dam. This will ensure the supply of safe, reliable, and sufficient supply of water to meet its present and future requirements. Also, the plan adopts green technology in relation to water supply augmentation including rainwater harvesting.
Water supply for domestic and non-domestic uses are sourced from various providers. Main providers of water are Hiyas Water Resources, Inc., and Prime Water. They provide Level III service level in most barangays with coverage of as much as 100%. Meanwhile, Hagonoy Water District provides water to Barangay San Isidro II. Some still use deep well as source with as much as 22% share as reported in Barangay San Roque.
Eight (8) pumping stations are in operation to ensure continuous supply of water to its service area. - Power
Power requirement of the municipality is provided by MERALCO. Data from submitted barangay profiles indicate all households subscribed to MERALCO for their electricity needs. Barangay Binakod reported use of solar panel to supplement household power demand.
Transportation and Communication
- Road Network
The municipality of Paombong is vertically elongated where the upper half is surrounded by city of Malolos from the east, the municipality of Calumpit from the north, and the municipality of Hagonoy from the west, and the lower half is mostly coastal and is bounded by Manila Bay at its south. Paombong can be reached by land via Jacinto St., a provincial road connecting the municipality to Malolos and Hagonoy. From north, it can be accessed from Calumpit via Kapitangan-Longos Road, a barangay road. Transportation within the municipality is not limited on land as water transport plays a vital role in ensuring economic sustenance and on delivery of goods and services. - Seaport
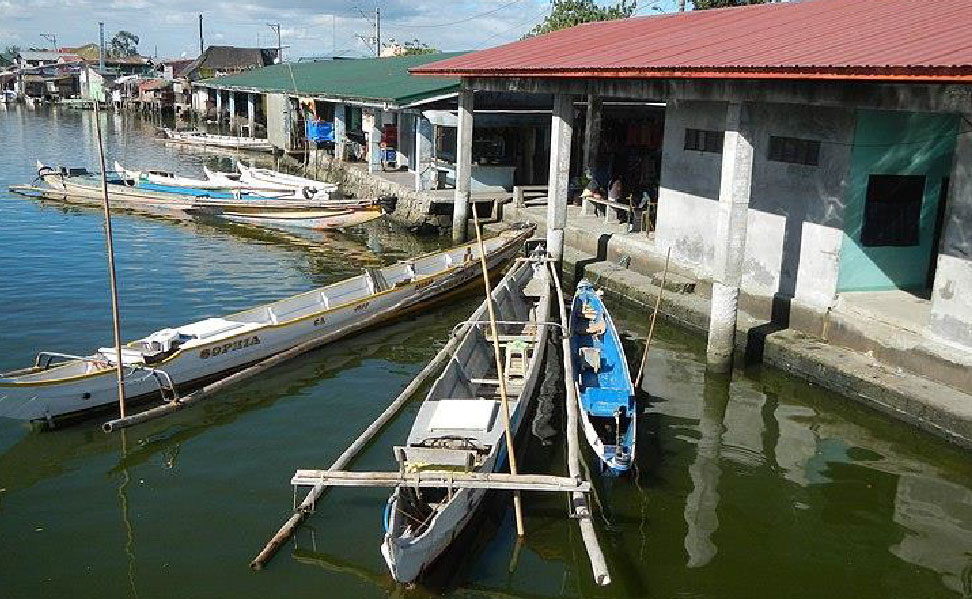
Community Fish Landing Center (CFLC) located at San Isidro 2, Paombong, Bulacan
San Jose Fish Port, Located at San Jose, Paombong, Bulacan - Telecommunication
SEP reports availability of postal service housed in the municipal building. The office has one postmaster, one postal clerk, and three postal carriers. Private couriers are also present but mostly in the población.
Major telecommunication companies have service coverage in the municipality. Landline use was reported with as much as 15% of the household using it in Barangay Malumot. At least 10 cell sites are in operation in the municipality for mobile and internet services, five (5) of which are identified in the report.
Education
- Primary School
- Secondary Schools
Basic education is being provided both by public and private sectors. The national government through the Department of Education (DepEd) is providing the kindergarten, elementary, and secondary education across the country. At present, there are 12 public elementary/pre-elementary schools and five (5) public high schools in Paombong. It is complimented by three (3) private elementary/pre-elementary schools and one (1) private high school. The number of day care centers in the area on the other hand, is 23. This is in compliance with the Republic Act No. 6972 mandating the establishment of day care center in every barangay for the total development and protection of children. The number of day care centers is more than the number of barangays in Paombong which shows compliance with the law. On the other hand, there is no technical or vocational school nor college facilities in the area.
High Rise Facilities and Infrastructures
- Infrastructure Facilities
- Transport and terminals
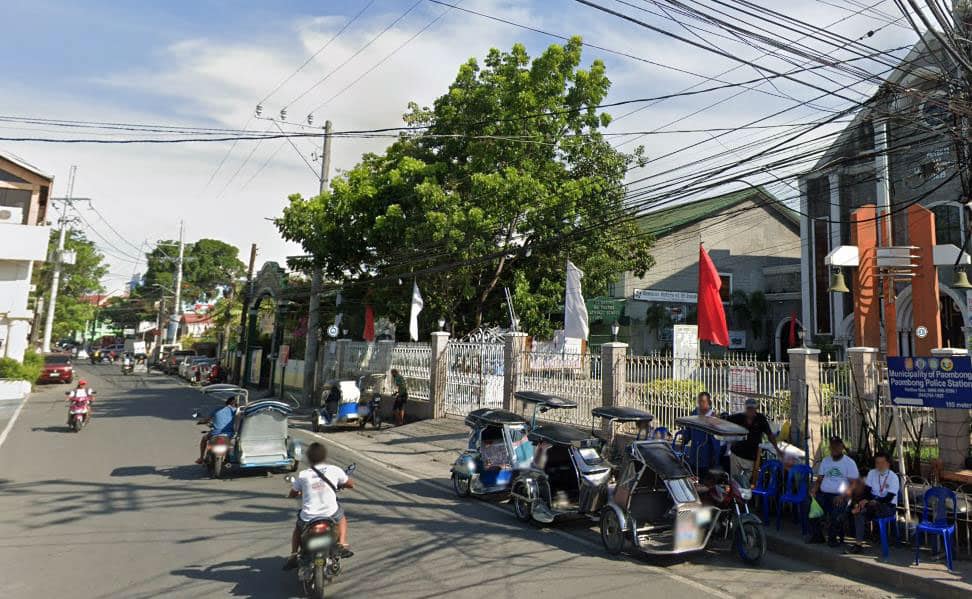
One of the main modes of transport in the municipality is tricycle. There are 17 TODAs reported operating within and through different barangays, reaching nearby towns and city as well. There are 2,470 tricycles registered in these TODAs.
Due to geographic feature of Paombong, another important transport mode in the municipality is water transport. SEP reported two ports that are operated by the local government.
- Transport and terminals
- Transportation/Road Network
The municipality of Paombong is vertically elongated where the upper half is surrounded by city of Malolos from the east, the municipality of Calumpit from the north, and the municipality of Hagonoy from the west, and the lower half is mostly coastal and is bounded by Manila Bay at its south. Paombong can be reached by land via Jacinto St., a provincial road connecting the municipality to Malolos and Hagonoy. From north, it can be accessed from Calumpit via Kapitangan-Longos Road, a barangay road. Transportation within the municipality is not limited on land as water transport plays a vital role in ensuring economic sustenance and on delivery of goods and services.- Roads and bridges
The total length of the road network in the municipality from a recent survey conducted is 46.84 km and is classified into provincial, municipal, and barangay roads. Provincial road spans 8.88 km which comprises 19% of the total network. Municipal road measures 7 km. which covers 15% of the network. The combined length of all barangay roads is 30.61 km., that is 66% of the total road network.
There are 31 bridges in the inventory provided. The total length of these bridges is 854.4 meters with width ranging from 1.0 m to 7.4 m. All bridges are made mainly from concrete and are assessed mostly in fair condition.
- Roads and bridges
- Social Services Facilities/Utilities/Amenities
- Health Facilities
In terms of health facilities, the municipality has three (3) Rural Health Units (RHU) and 12 Barangay Health Stations (BHS). These facilities are essential for the delivery of primary health care and maternal and childcare. As of 2018, there are one (1) private hospital, one (1) lying-in, one (1) private clinic, and two (2) medical laboratories in the municipality providing health services to the citizens.
- Health Facilities
Physical Demographic Profile
Geographical Information
- Geographical Information
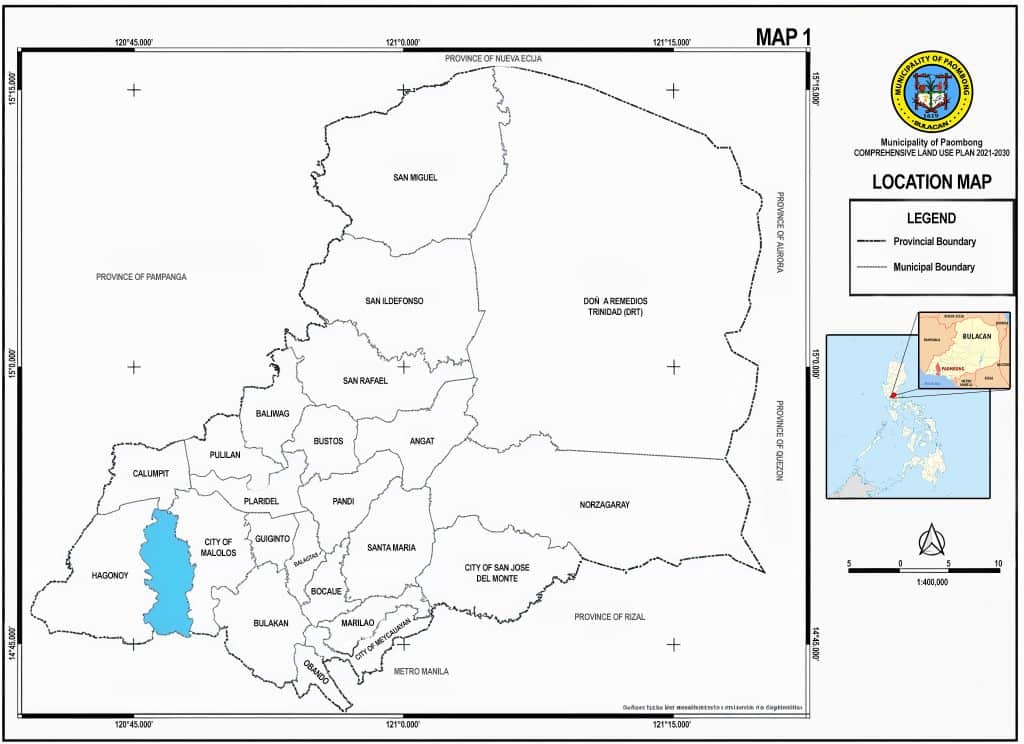
- Location
The municipality of Paombong is in the southern part of the province of Bulacan with geographic coordinates of 120°45’14.6″E and 120°48’29.9″E longitudes and 14°52’19.2″N and 14°45’22.34″N latitudes. It is bounded by the municipality of Calumpit in the north, City of Malolos in the east, municipality of Hagonoy on the west and Manila Bay in the south.
The municipality can be reached from a limited access points coming from the Manila North Road (MNR). One is via Paseo del Congreso Road or segment of the Plaridel-Bigaa National Highway and the Malolos-Paombong-Calumpit Provincial Road. The town is about 2.4 kilometers away using this route. Paombong can also be accessed from the MNR using the Blas Ople Diversion Road as an alternate route that will take an approximately 2.6 kilometers long travel from MNR. Another route if one is coming from the town of Calumpit is through Barangay Longos, City of Malolos. - Land Area
- Territorial Jurisdiction and Barangay Subdivision
Is the land area distribution per barangay of Paombong based on the records of the Municipal Planning and Development Office (MPDO) from their Socio-Economic Profile (SEP) and from the tax maps records of the Assessor’s Office. The area generated from the tax maps utilizes geographic information system or GIS as a tool where digitized cadastral and tax maps are measured. It can be noted that the total area generated from GIS is close to the total area from MPDO. It recorded a difference of only 84.92 hectares.
However, the GIS generated area of 4,383.55 hectares recorder a larger discrepancy from the official land area issued by the Department of Environment and Natural Resources – Land Management Bureau (DENR-LMB). According to the said department, the municipality of Paombong has a total land area of 4,634 hectares. This is about 165 has difference.
For planning purposes, the plan shall adopt the 4,383.55 hectares to perform the needed planning and spatial analysis. However, since LMB is the authority when it comes to land area, the municipality of Paombong still recognizes the use of 4,634 hectares as its official land area for the basis of the Department of Budget and Management in the computation of Internal Revenue Allotment.
Table 1: Land Area Distribution by BarangayBARANGAY AREA (HECTARES) SEP TAX MAPS Binakod 581.77 444.77 Kapitangan 206.05 208.68 Malumot 5.91 6.59 Masukol 478.98 491.47 Pinalagdan 284.13 160.47 Poblacion 9.20 9.07 San Isidro I 45.37 40.43 San Isidro II 505.53 483.71 San Jose 876.64 997.51 San Roque 629.64 708.63 San Vicente 100.84 102.41 Santa Cruz 368.32 421.83 Santo Niño 107.22 108.05 Santo Rosario 268.87 199.97 TOTAL 4,468.47 4,383.55
Barangay San Jose is considered the largest barangay unit in the municipality of Paombong in terms of land area, which measures about 997.51 hectares or 23% of the total land area of the town. This is followed by Barangay San Roque, Masukol, and San Isidro II at 708.63 has, 491.47 has, 483.71 has respectively. While the smallest Barangay is Malumot with an area of about 5.91 hectares or about 7% of the total land area of Paombong. Error! Reference source not found. shows the land area distribution of the municipality of San Ildefonso per Barangay arranged from largest to smallest.
Table 2: Land Area Distribution by Barangay, Largest to SmallestBARANGAY AREA (HECTARES) SEP TAX MAPS San Jose 876.64 997.51 San Roque 629.64 708.63 Masukol 478.98 491.47 San Isidro II 505.53 483.71 Binakod 581.77 444.77 Santa Cruz 368.32 421.83 Kapitangan 206.05 208.68 Santo Rosario 268.87 199.97 Pinalagdan 284.13 160.47 Santo Niño 107.22 108.05 San Vicente 100.84 102.41 San Isidro I 45.37 40.43 Poblacion 9.2 9.07 Malumot 5.91 6.59 TOTAL 4,468.47 4,383.55
- Territorial Jurisdiction and Barangay Subdivision
- Classification
- Land Classification
The province of Bulacan can be categorized into two (2) major land classification according to the DENR. These are Alienable and Disposable (A & D) and Forest Lands. The A & D areas refers to lands of public domain which have not been the subject of the present system of classification and declared not needed for forest purposes. These are classified into settlements, built-up and production areas. It is estimated that about 66% (1,851 sq.km.) of the total land area in Bulacan is A & D based on DENR-LMB records. Forest Lands on the other hand are further categorized into three (3), protected forest land (NIPAS), Non-NIPAS Protection Forests and the production forests. In the province of Bulacan, forest lands are found on the western part where the watershed and other protected areas are located. This includes Angat Watershed, General Tinio watershed, Ipo watershed and Biak-na-Bato National Part.
Is the derived land classification map of the municipality of Paombong based on the available land classification map of the Provincial Development and Physical Framework Plan (PDPFP). Obviously, the whole town of Paombong is classified under the A & D lands. This means that lands in the town can be owned by any private individual.
- Land Classification
- Political Division
- Population
- Religious Affiliation
- Language Dialect Literacy
- Location
DEMOGRAPHIC PROFILE AND PHYSICAL FEATURES
- Demography
According to the Philippine Statistics Authority (PSA), the population of Paombong was 53,294 in 2015.The municipality ranked second least populous among cities and municipalities of Bulacan. The percent share of Paombong’s population to the total population of Bulacan was 1.62.On the other hand, its household size was 4.4 which is higher than that of Bulacan at 4.3 (Table 3).
Table 3: Ranking of Population among Cities/Municipalities in the ProvinceRANK PROVINCE/CITY/MUNICIPALITY 2015 POPULATION % TO TOTAL BULACAN POPULATION AVERAGE HOUSEHOLD SIZE BULACAN 3,292,071 100.00 4.3 1 City of San Jose Del Monte 574,089 17.44 4.0 2 Santa Maria 256,454 7.79 4.2 3 City of Malolos (Capital) 252,074 7.66 4.1 4 Marilao 221,965 6.74 4.4 5 City of Meycauayan 209,083 6.35 4.2 6 San Miguel 153,882 4.67 4.2 7 Baliwag 149,954 4.56 4.4 8 Hagonoy 129,807 3.94 4.3 9 Bocaue 119,675 3.64 4.3 10 Norzagaray 111,348 3.38 4.3 11 Calumpit 108,757 3.30 4.2 12 Plaridel 107,805 3.27 4.0 13 San Ildefonso 104,471 3.17 4.5 14 Guiguinto 99,730 3.03 4.3 15 Pulilan 97,323 2.96 4.4 16 San Rafael 94,655 2.88 4.5 17 Pandi 89,075 2.71 4.4 18 Bulakan 76,565 2.33 4.3 19 Balagtas (Bigaa) 73,929 2.25 4.3 20 Bustos 67,039 2.04 4.5 21 Angat 59,237 1.80 4.5 22 Obando 59,197 1.80 4.2 23 PAOMBONG 53,294 1.62 4.4 24 Doña Remedios Trinidad 22,663 0.69 4.5
The population of Paombong grew on the average by 0.86 annually. It is lower than that of the province and of the country which have an Annual Growth Rate (AGR) of 2.28 and 1.72 percent, respectively. Further, Paombong was fourth (4th) among the towns in Bulacan with low growth rate of the population. Its population is expected to double in 80 years (Table 4).
Table 4: Population by Barangay (2010 & 2015, Growth Rate, Doubling Time, and Year)BARANGAY 2010 TOTAL POPULATION 2015 TOTAL POPULATION GROWTH RATE DOUBLING TIME DOUBLING YEAR PAOMBONG 50,940 53,294 0.86 80 2095 Binakod 1,506 1,582 0.94 73 2088 Kapitangan 3,897 4,262 1.72 40 2055 Malumot 1,703 1,439 -3.16 Masukol 1,903 1,545 -3.89 Pinalagdan 2,612 3,163 3.71 19 2034 Poblacion 1,279 1,194 -1.30 San Isidro I 3,448 3,641 1.04 66 2081 San Isidro II 10,366 11,177 1.45 48 2063 San Jose 4,818 5,211 1.50 46 2061 San Roque 4,764 4,847 0.33 209 2224 San Vicente 2,792 2,811 0.13 534 2549 Santa Cruz 1,476 1,611 1.68 41 2056 Santo Niño 3,575 3,640 0.34 201 2216 Santo Rosario 6,801 7,171 1.01 68 2083
Of the 14 barangays in Paombong, Barangay Pinalagdan grew the fastest at the rate of 3.71. This is higher than the rate of the municipality and of the province. With this rate, the population of Barangay Pinalagdan is expected to double in 19 years. Further, seven (7) barangays (50%) had growth rates higher than the municipal rate. Conversely, Barangay Malumot, Masukol, and Poblacion had negative growth rate at (-3.16), (-3.89), and (-1.30), respectively. Factors affecting change in the population are birth and death rate, and migration.
Table 5: Population Composition by Working - Age and Dependent - Age Group (2015)INDICATOR BULACAN PAOMBONG % SHARE 0 – 14 Years Old 967,721 15,034 28 15 – 64 Years Old 2,173,908 35,353 66 65 Years Old and Above 150,442 2,907 6 Dependent population below 15 and 65 and above 1,118,163 17,941 Total Dependency Ratio 51 51 Young Dependency Ratio 45 43 Old Dependency Ratio 7 8
The economically productive age groups 15 – 64 years old constitute 66% of the total population of Paombong in 2015 as presented in the Table 6. The remaining 34 percent constitute the dependent population that belongs to 0 – 14 years old or the young dependents and 65 years old and over or the old dependents. It means that for every 100 working – age population in Paombong, there are 51 dependents (43 young dependents and 8 old dependents).
Table 6: Population Composition by School - Age and Sex (2015)AGE GROUP BOTH SEXES MALE FEMALE SEX RATIO ALL AGES 53,294 26,705 26,589 100 Under 1 1,027 522 505 103 1 – 4 3,943 2,037 1,906 107 5 – 9 5,151 2,636 2,515 105 10 – 14 4,913 2,547 2,366 108 15 – 19 5,104 2,622 2,482 106 20 – 24 5,113 2,595 2,518 103 25 – 29 4,462 2,263 2,199 103 30 – 34 4,007 2,004 2,003 100 35 – 39 3,827 1,894 1,933 98 40 – 44 3,312 1,641 1,671 98 45 – 49 3,204 1,630 1,574 104 50 – 54 2,624 1,294 1,330 97 55 – 59 2,062 1,068 994 107 60 – 64 1,638 784 854 92 65 – 69 1,259 577 682 85 70 – 74 740 313 427 73 75 – 79 461 156 305 51 80 years and over 447 122 325 38
In terms of age and sex distribution, there were more males than females in age groups 0 to 34, 45-49, and 55-59 in 2015. In contrast, there were more females than males in age groups 35-44, 50-54, and in the older age group 60 years old and over.
In terms of land area, Paombong has a total land area of approximately 46.34 square kilometers. Using the 2015 population, the population density of Paombong was recorded at 1,150 persons per square kilometer. The municipality was 10th least dense among the component cities and municipalities of Bulacan.
Table 7: Population, Land Area, and Density (2015)
* Land area is based on cadastral survey (certified and provided to the DBM) from the LMB, DENR, as of December 2013.
** Estimated land area (certified and provided to the DBM) from the LMB, DENR, as of December 2013.
PROVINCE/CITY/MUNICIPALITY POPULATION LAND AREA (SQ.KM.) POPULATION DENSITY (PERSON PER SQ.KM.) BULACAN 3,292,071 2,783.69 1,183 Angat * 59,237 61.59 962 Balagtas * 73,929 28.66 2,580 Baliwag* 149,954 45.05 3,329 Bocaue ** 119,675 31.87 3,755 Bulakan ** 76,565 72.90 1,050 Bustos ** 67,039 69.99 958 Calumpit ** 108,757 56.25 1,933 Doña Remedios Trinidad ** 22,663 932.96 24 Guiguinto ** 99,730 27.50 3,627 Hagonoy * 129,807 103.10 1,259 Marilao ** 221,965 33.74 6,579 Norzagaray ** 111,348 309.77 359 Obando ** 59,197 52.10 1,136 Pandi ** 89,075 31.20 2,855 PAOMBONG * 53,294 46.34 1,150 Plaridel * 107,805 32.44 3,323 Pulilan * 97,323 39.89 2,440 San Ildefonso * 104,471 128.71 812 San Miguel ** 153,882 231.40 665 San Rafael ** 94,655 152.43 621 Santa Maria ** 256,454 90.92 2,821 City of Malolos (Capital) * 252,074 67.25 3,748 City of Meycauayan ** 209,083 32.10 6,513 City of San Jose del Monte ** 574,089 105.53 5,440
Urban barangay on the other hand as defined by the PSA, is a barangay with the population of 5,000 or more. In 2010, two (2) barangays in Paombong out of its 14 barangays were classified as urban and in 2015, Barangay San Jose was classified urban resulting to the increase of the number to 3 urban barangays. The level of urbanization in 2015 or the proportion of urban populations to the total population of Paombong was 44 percent.
Table 8: Urban Barangays, Year 2010 & 2015BARANGAY 2010 TOTAL POPULATION 2015 TOTAL POPULATION PAOMBONG 50,940 53,294 San Isidro II 10,366 11,177 San Jose 4,818 5,211 Santo Rosario 6,801 7,171 TOTAL 21,985 23,559
According to the PSA, the 2015 based populations may be projected up to five (5) years (for lesser projection error) that can be used for planning and targeting. They also released projection of populations of the national level down to provincial level. However, no population projection is available at the municipal and barangay level. Despite the remarked bigger error in projecting the population at the municipal and barangay level, the projected population presented in the Table 9 was computed for planning purposes only. The projection of populations was calculated using the geometric method wherein the geometric growth rates assumed that the annual net addition to the base population is included in the computation of population growth. The population projection from 2016 to 2028 is presented below. Conversely, the population of Barangay Malumot, Masukol, and Poblacion cannot be projected because of the negative growth rate of the said barangays from 2010 to 2015 population. It should be regarded further that the projected population of the province is not equal to the total projected population of cities/municipalities due to different annual growth rates.
Table 9: Population Projection by Barangay, Year 2016-2028BARANGAY 2015 TOTAL POPULATION 2016 2017 2018 2019 2020 2021 2022 2023 2024 2025 2026 2027 2028 PAOMBONG 53,294 53,755 54,219 54,688 55,160 55,637 56,118 56,603 57,092 57,585 58,083 58,585 59,091 59,602 Binakod 1,582 1,597 1,612 1,627 1,642 1,658 1,674 1,689 1,705 1,721 1,738 1,754 1,770 1,787 Kapitangan 4,262 4,335 4,410 4,486 4,563 4,641 4,721 4,802 4,885 4,969 5,054 5,141 5,230 5,320 Malumot 1,439 Masukol 1,545 Pinalagdan 3,163 3,280 3,402 3,529 3,660 3,795 3,936 4,083 4,234 4,391 4,554 4,724 4,899 5,081 Poblacion 1,194 San Isidro I 3,641 3,679 3,717 3,756 3,795 3,835 3,875 3,915 3,956 3,997 4,039 4,081 4,124 4,167 San Isidro II 11,177 11,339 11,502 11,669 11,837 12,008 12,182 12,358 12,536 12,718 12,901 13,088 13,277 13,469 San Jose 5,211 5,289 5,369 5,450 5,532 5,615 5,700 5,785 5,872 5,961 6,050 6,141 6,234 6,328 San Roque 4,847 4,863 4,879 4,895 4,911 4,927 4,944 4,960 4,976 4,993 5,009 5,026 5,042 5,059 San Vicente 2,811 2,815 2,818 2,822 2,826 2,829 2,833 2,837 2,840 2,844 2,848 2,851 2,855 2,859 Santa Cruz 1,611 1,638 1,666 1,694 1,722 1,751 1,780 1,810 1,841 1,872 1,903 1,935 1,968 2,001 Santo Niño 3,640 3,653 3,665 3,678 3,690 3,703 3,716 3,729 3,741 3,754 3,767 3,780 3,793 3,806 Santo Rosario 7,171 7,244 7,317 7,391 7,466 7,542 7,619 7,696 7,774 7,853 7,932 8,013 8,094 8,176
GEOGRAPHICAL PROFILE
Location
Located in the southern part of the province of Bulacan
Bounded by the Municipality of:
- Calumpit in the north
- City of Malolos in the east
- Hagonoy on the west
- The Manila Bay in the south
Land Area
- The official land area is 4,634 hectares based on the Department of Environment and Natural Resources Land Management Bureau (DENR
LMB) - 14 Barangays
Classification
3rd Class Municipality
PHYSICAL PROFILE
TOPOGRAPHY
- Generally flat
- Covered by agricultural plains (Majority of Fishpond)
- The remaining crop production are found further north of the town.
- Built environment is mostly located along road networks, when concentration is found along major thoroughfares.
CLIMATE
- Classified under Type I climate category based on the modified Corona’s Philippine Climate Classification 1951-2003.
- According to this category, areas with this type of climate have distinct pronounce wet and dry seasons.
- Rainy season – June to November
- Dry season – December to April
However, business registrations do not reflect that the fishery and the processing of fishery products are the major industries. Instead, the service sector or those engaged in trading and other services has the lion’s share of the combined gross receipts at 86.13 percent. Meanwhile, about 13.07 percent is the contribution of the industry group, specifically construction and food processing and the remaining 0.80 percent is the share of the primary sector or the agriculture.
MAJOR PRODUCTS
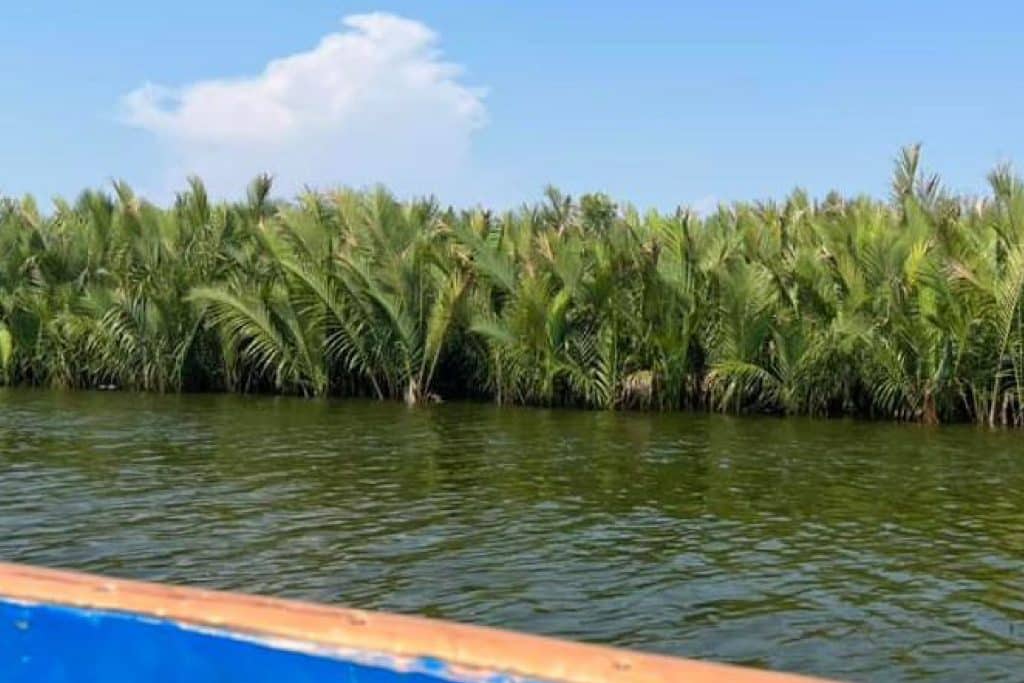
The major products of Paombong includes Condiments such as Vinegar (Suka), Fish Sauce (Patis), and Salts (Asin). Paombong is also known for havesting Nipa and Agricultural products such as Rice, Poultry, Livestock, and Fisheries.
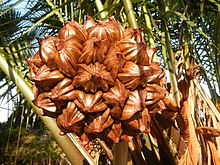
Sasa/Nipa Fruit

Salt
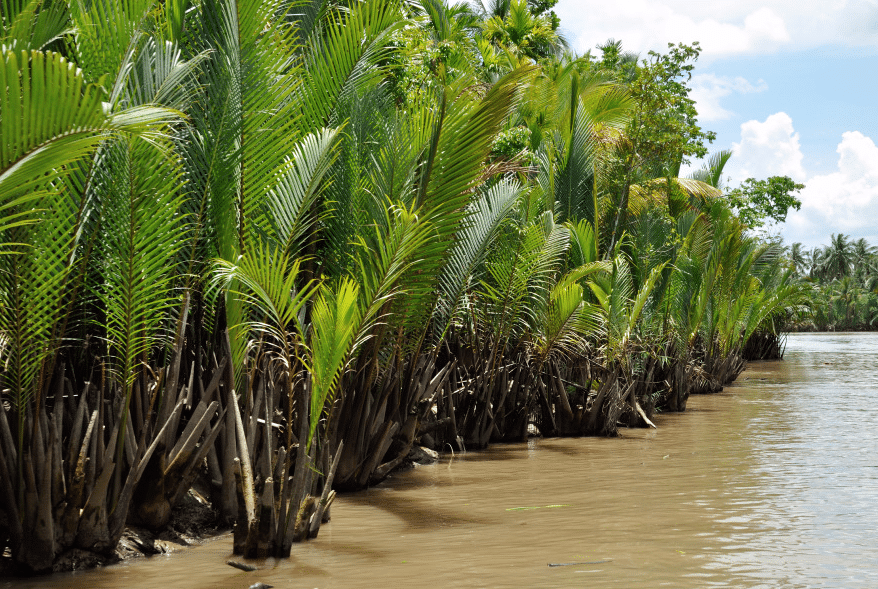
Sasa/Nipa Tree

Poultry
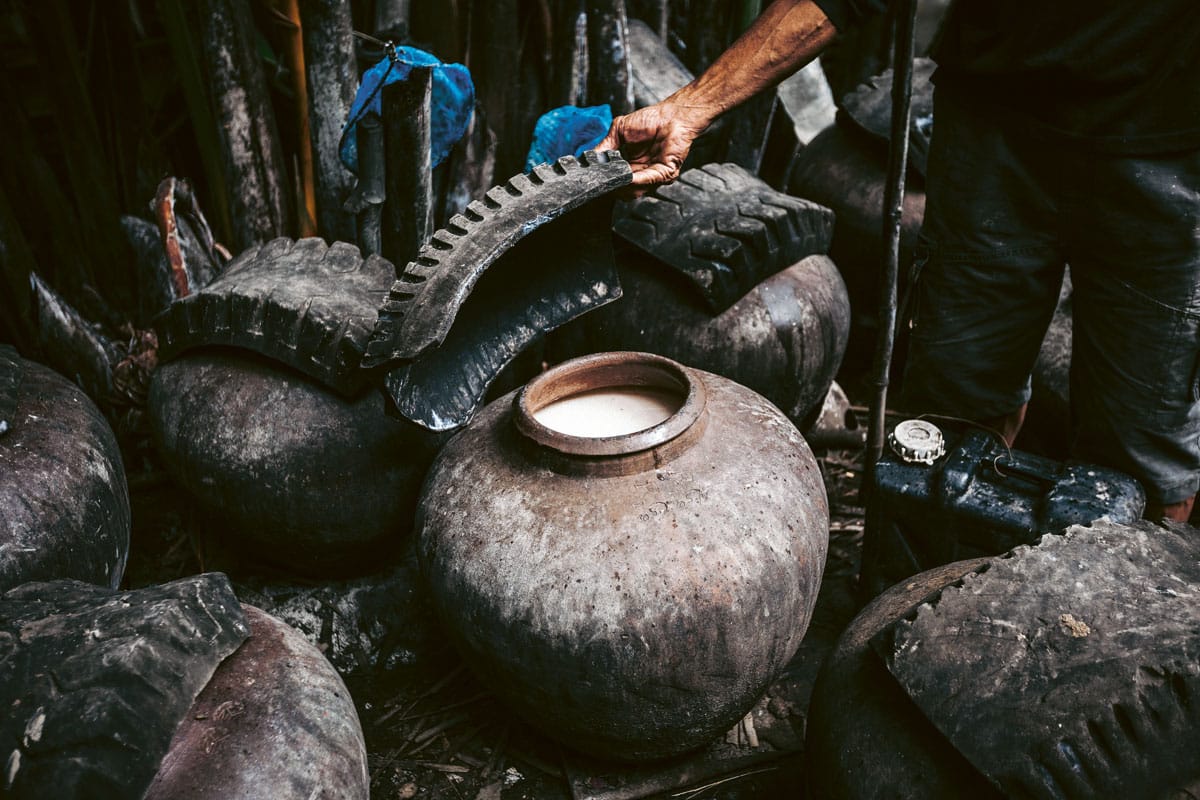
Vinegar

Fish Sauce

Rice

Fisheries
INFRASTRUCTURE
& UTILITIES
Transport and Terminals
• One of the main modes of transport in the municipality is tricycle
– There are 17 TODAs reported operating with 2 470 registered tricycles
• Another important transport mode is water transport.
– There are 2 ports operated by the local government (SEP)
ENVIRONMENT
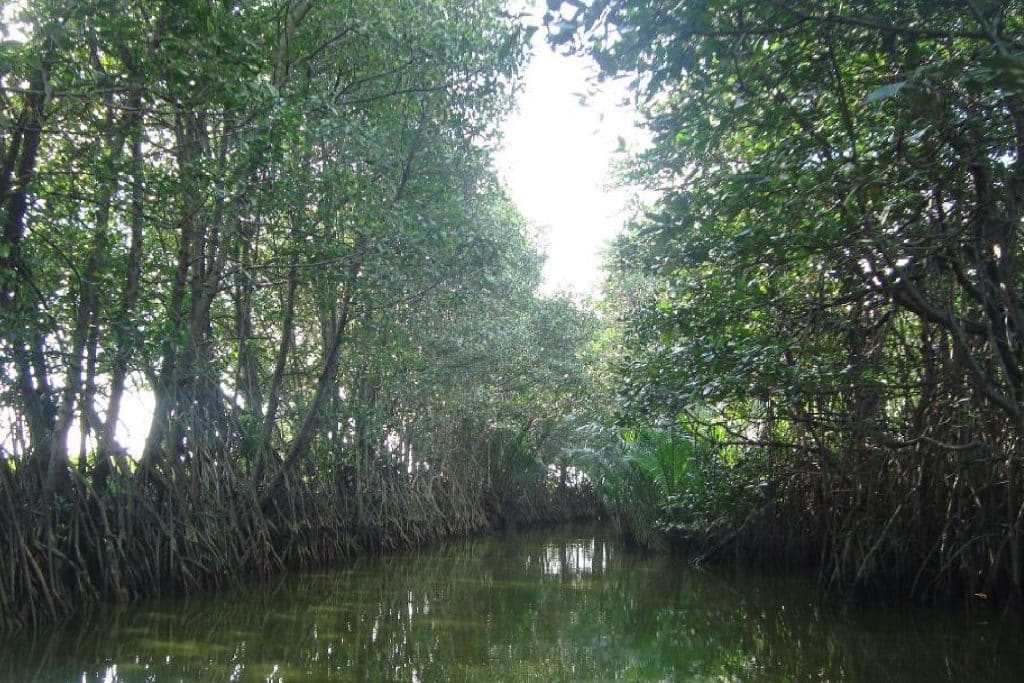
Coastal and Marine Resources
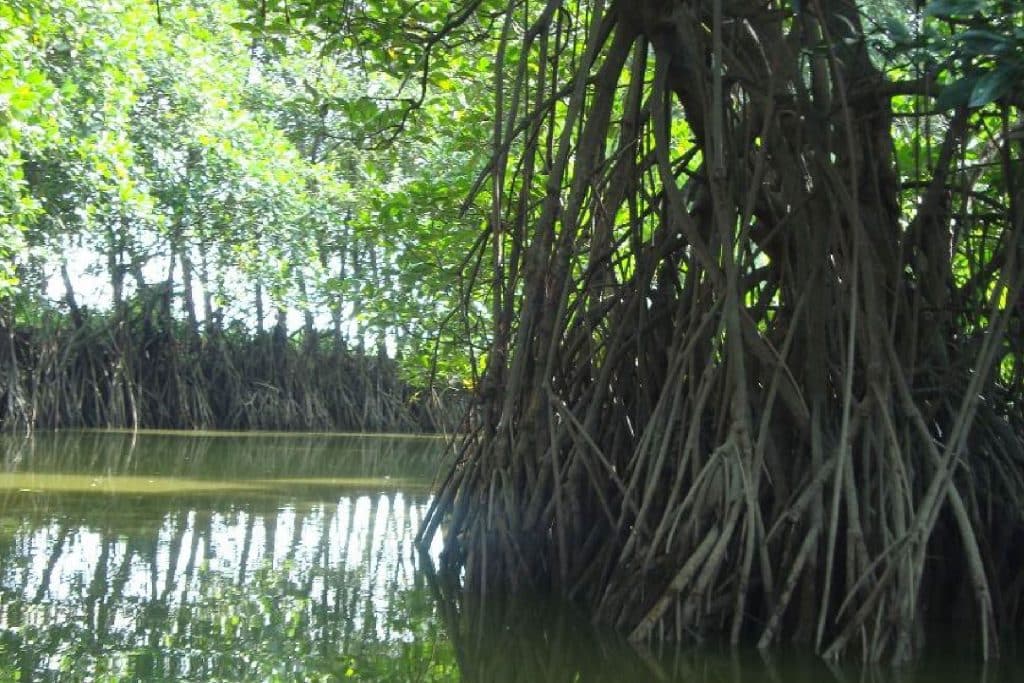
Almost 10 0 hectares are covered with various species of mangroves while 282 57 hectares are covered particularly with nipa
Majority of the town’s fisherfolks are in involved in fish capture.
Fish catch is a mix of small and large fish which includes bangus, tilapia, sapsap, kanduli, sinilyasi, lapu-lapu, malakapas, bidbid, kitang, abu-abo, aligasin, biya, tunsoy, bulig, hito, gurami, and carpa.
There is a total of 3 557 63 hectares of fishponds for brackish water aquaculture production (2016)
– Majority of the barangays are engaged in brackish aquaculture production except for barangay Malumot
– There are 2 to 3 cropping per year with cultured species such as bangus, sugpo, vannamei, tilapia, and mudcrabs.

Bangus
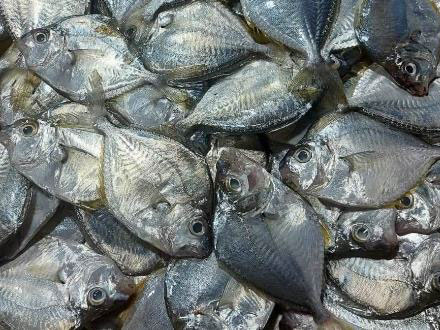
Sapsap

Kitang

Tilapia
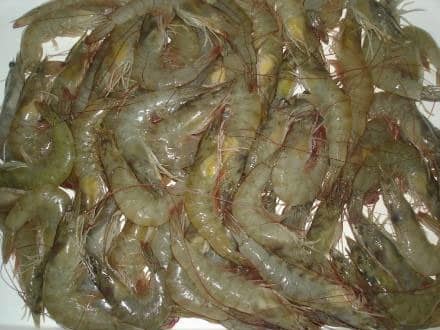
Vannamei

Mud Crab
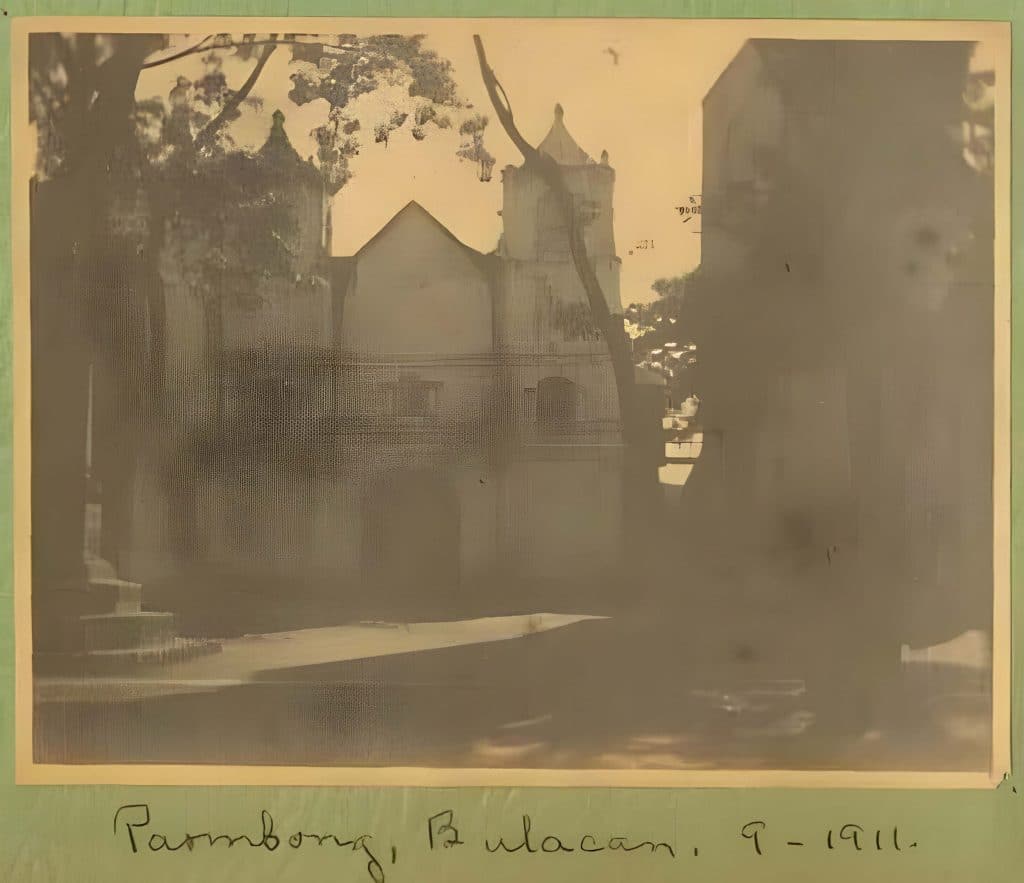
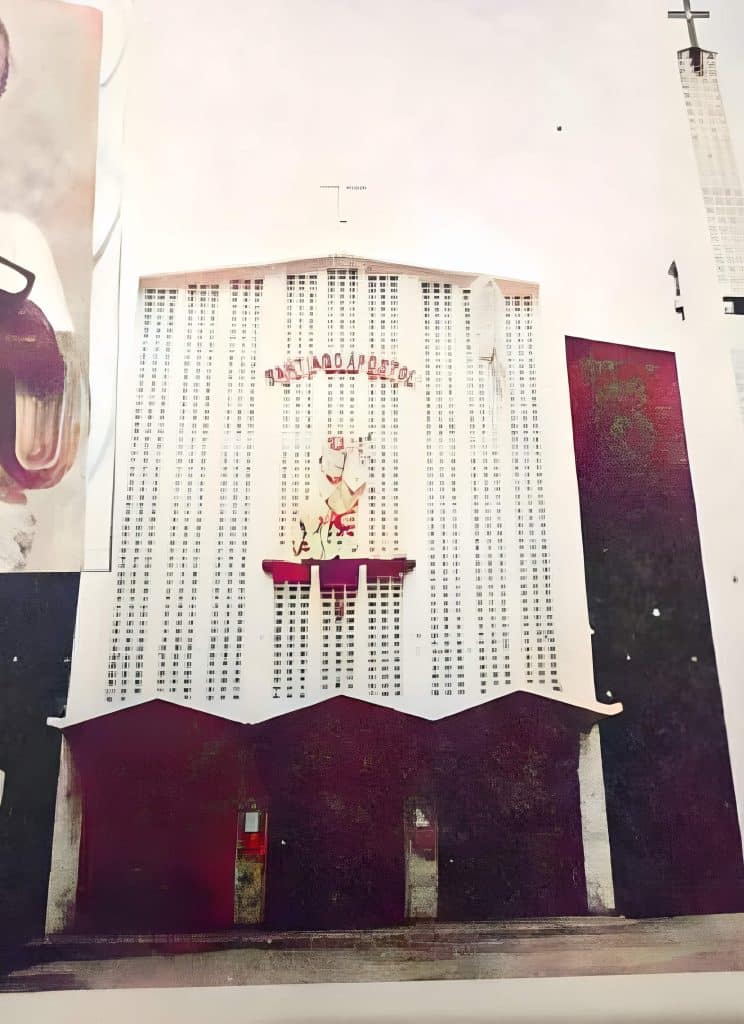
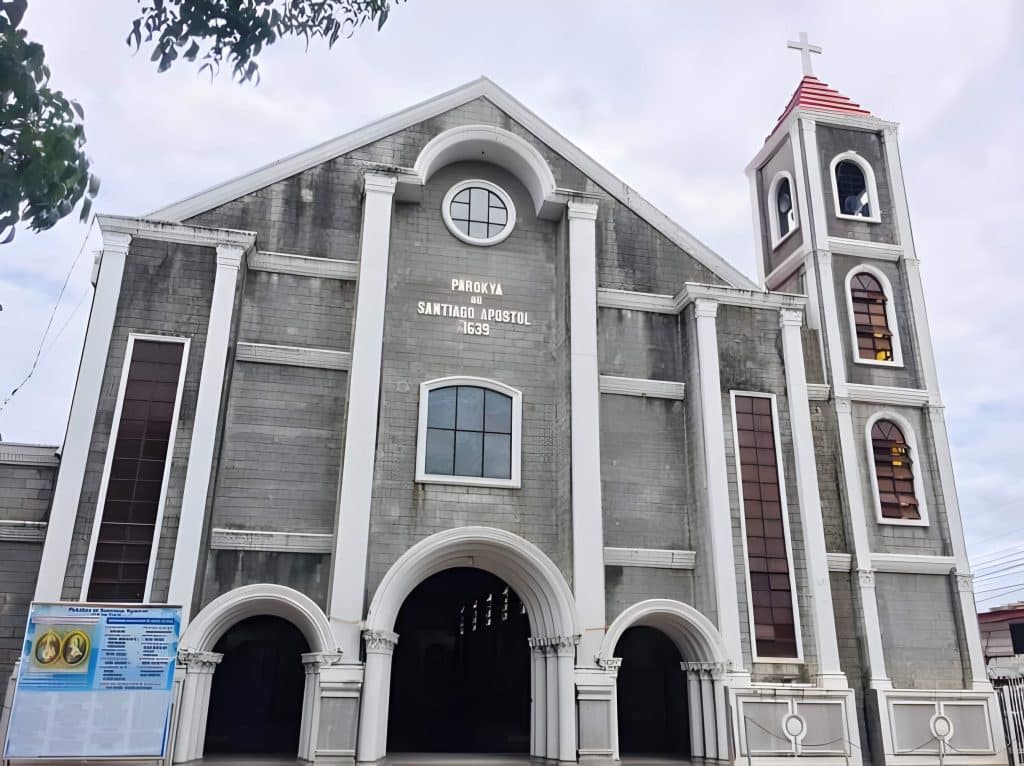
HERTITAGE CONSERVATION
Tangible cultural heritage of the town are The Paombong Church Convent in Barangay Poblacion General Isidoro Torres Monument in Barangay Binakod, and the Senakulo – a commemoration of the passion of Christ in Barangay Kapitangan
SOCIAL SERVICES
EDUCATION
- 22 day care centers
- 12 public elementary/pre elementary schools
- 5 public high schools
- 3 private elementary/pre elementary schools
- 1 private high school.
- No technical or vocational school or college facilities
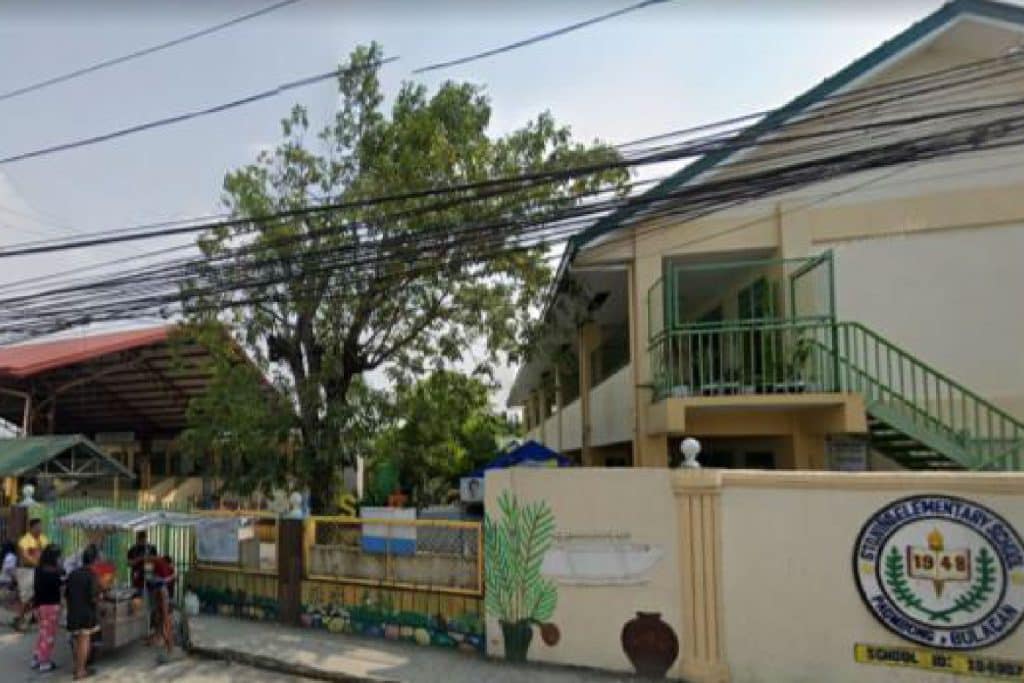
Sto. Niño Elementary School
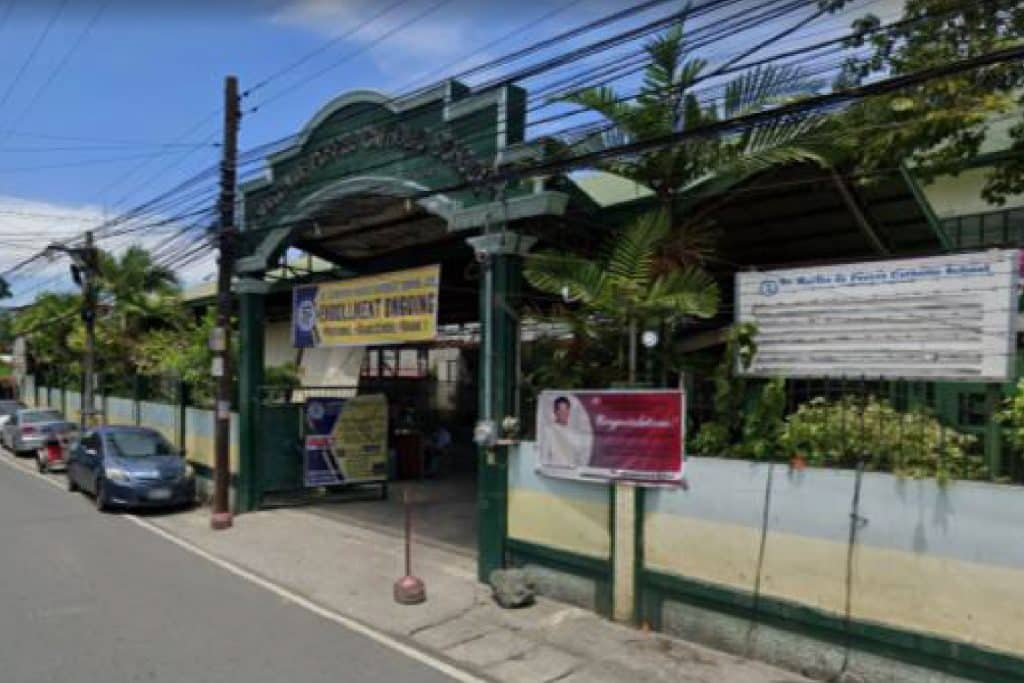
St. Martin De Porres Catholic School
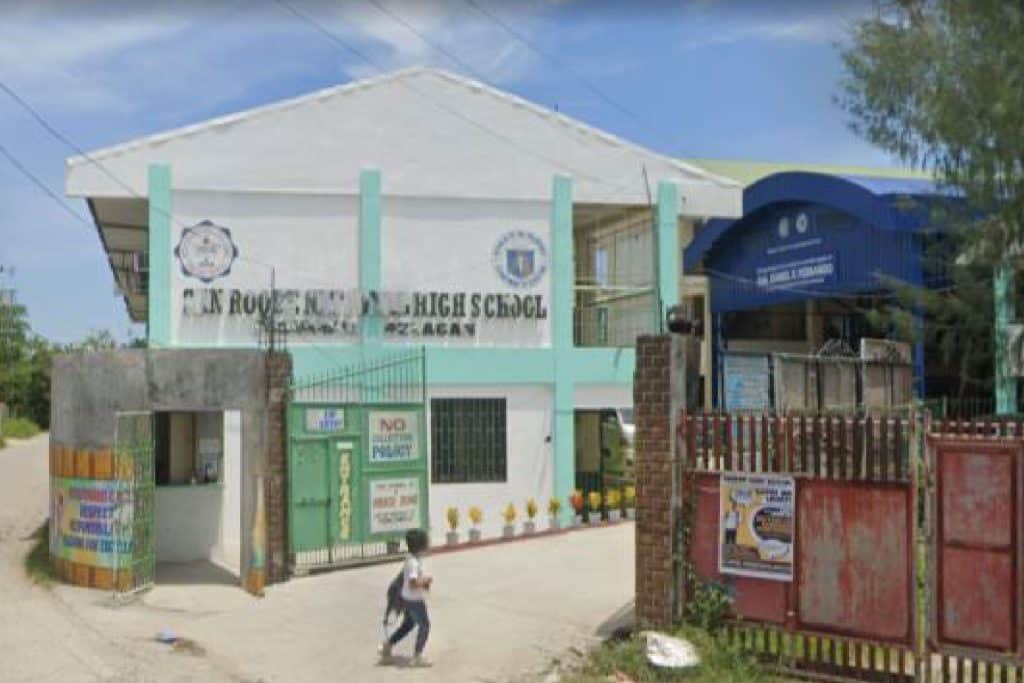
San Roque National High School
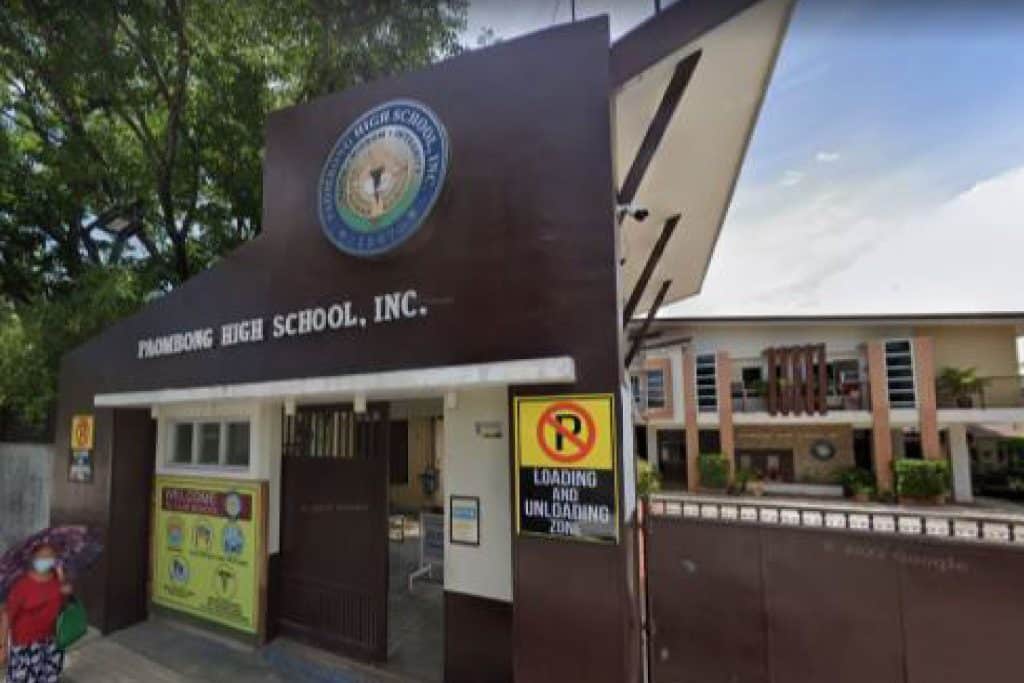
Paombong High School, Inc.
HEALTH FACILITIES
There are 3 Rural Health Units (RHU) and 11 Barangay Health Stations for the delivery of primary health care and maternal and childcare.
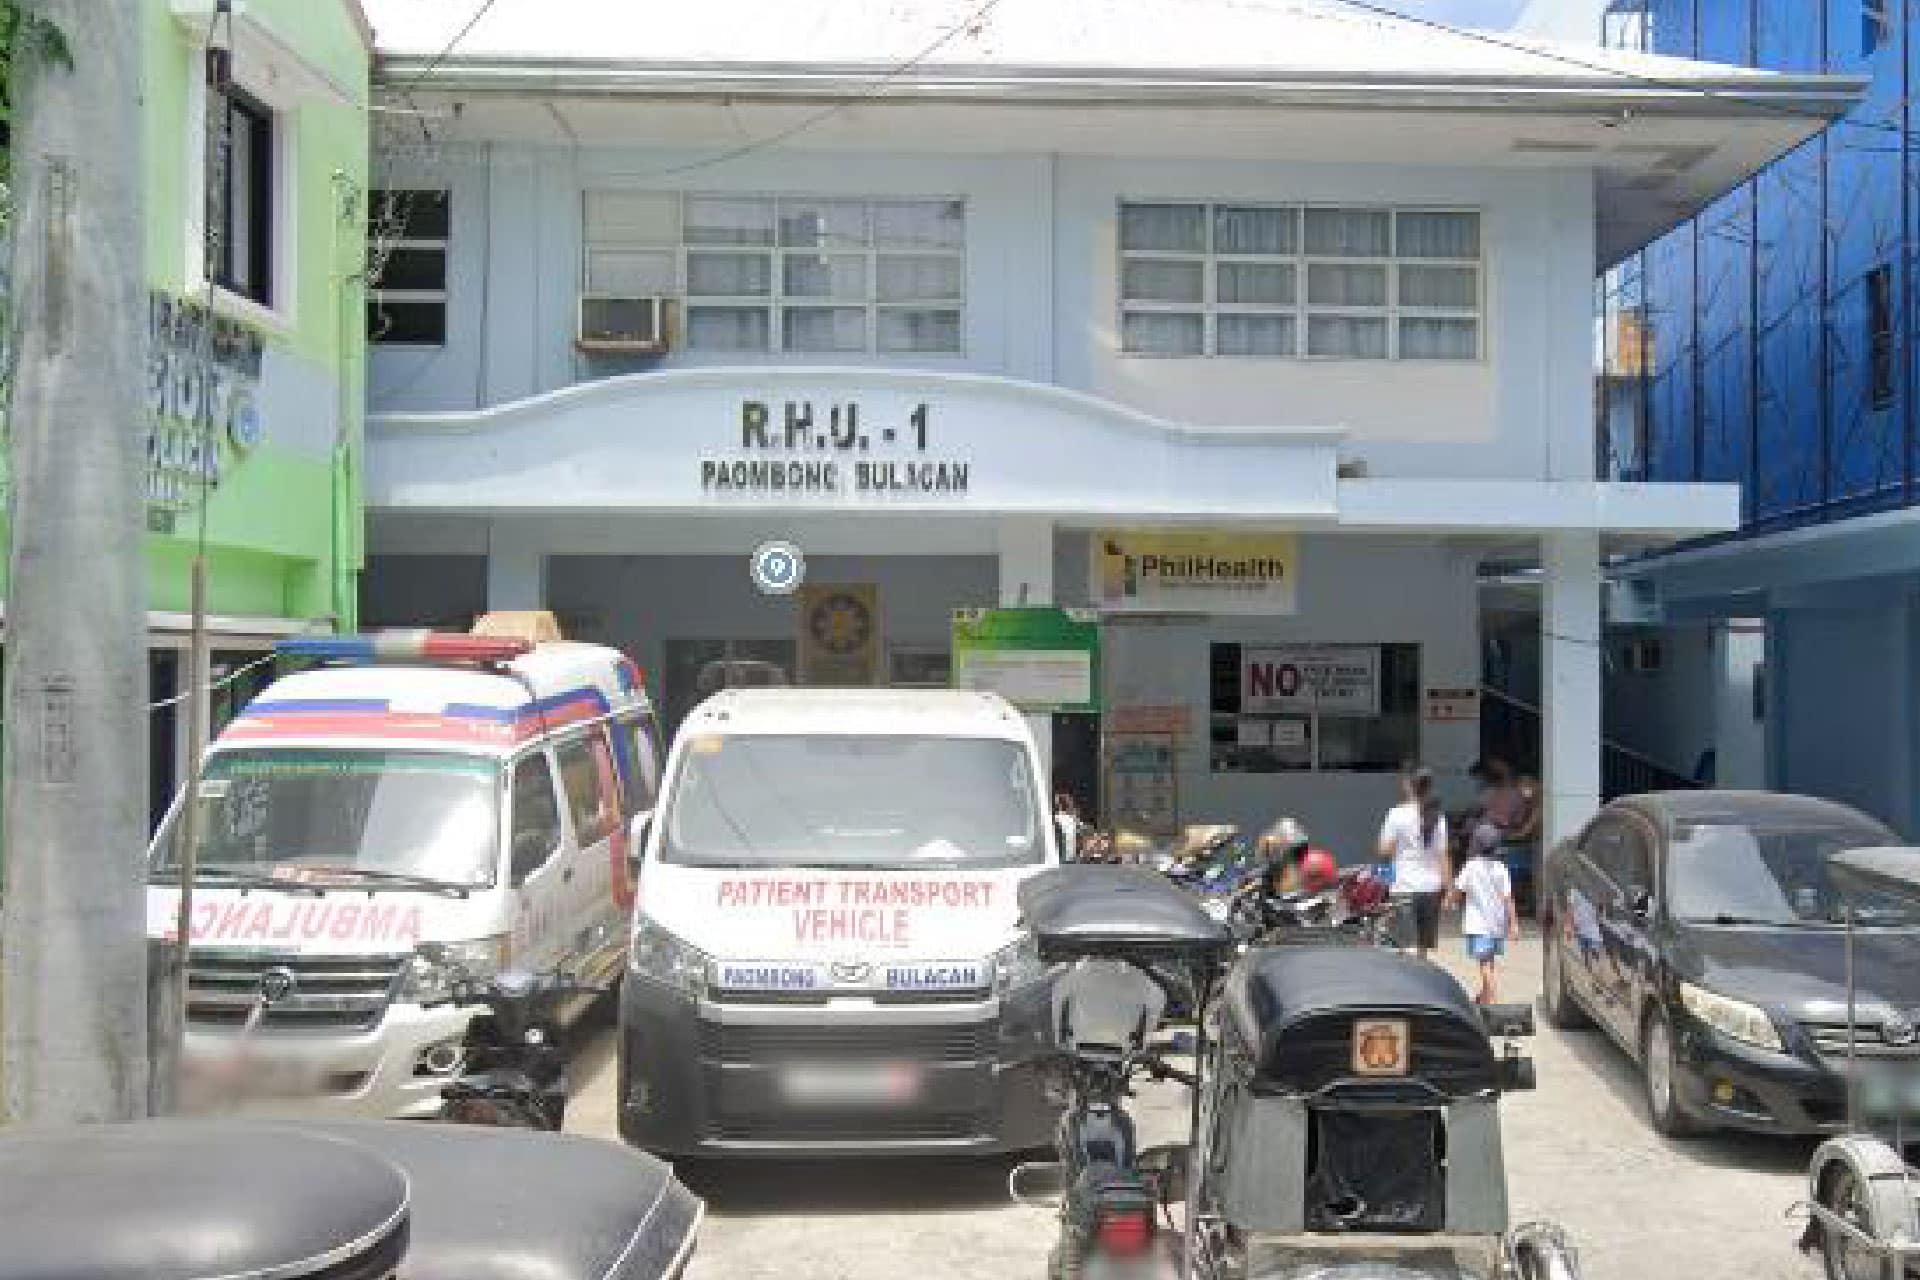
RHU 1
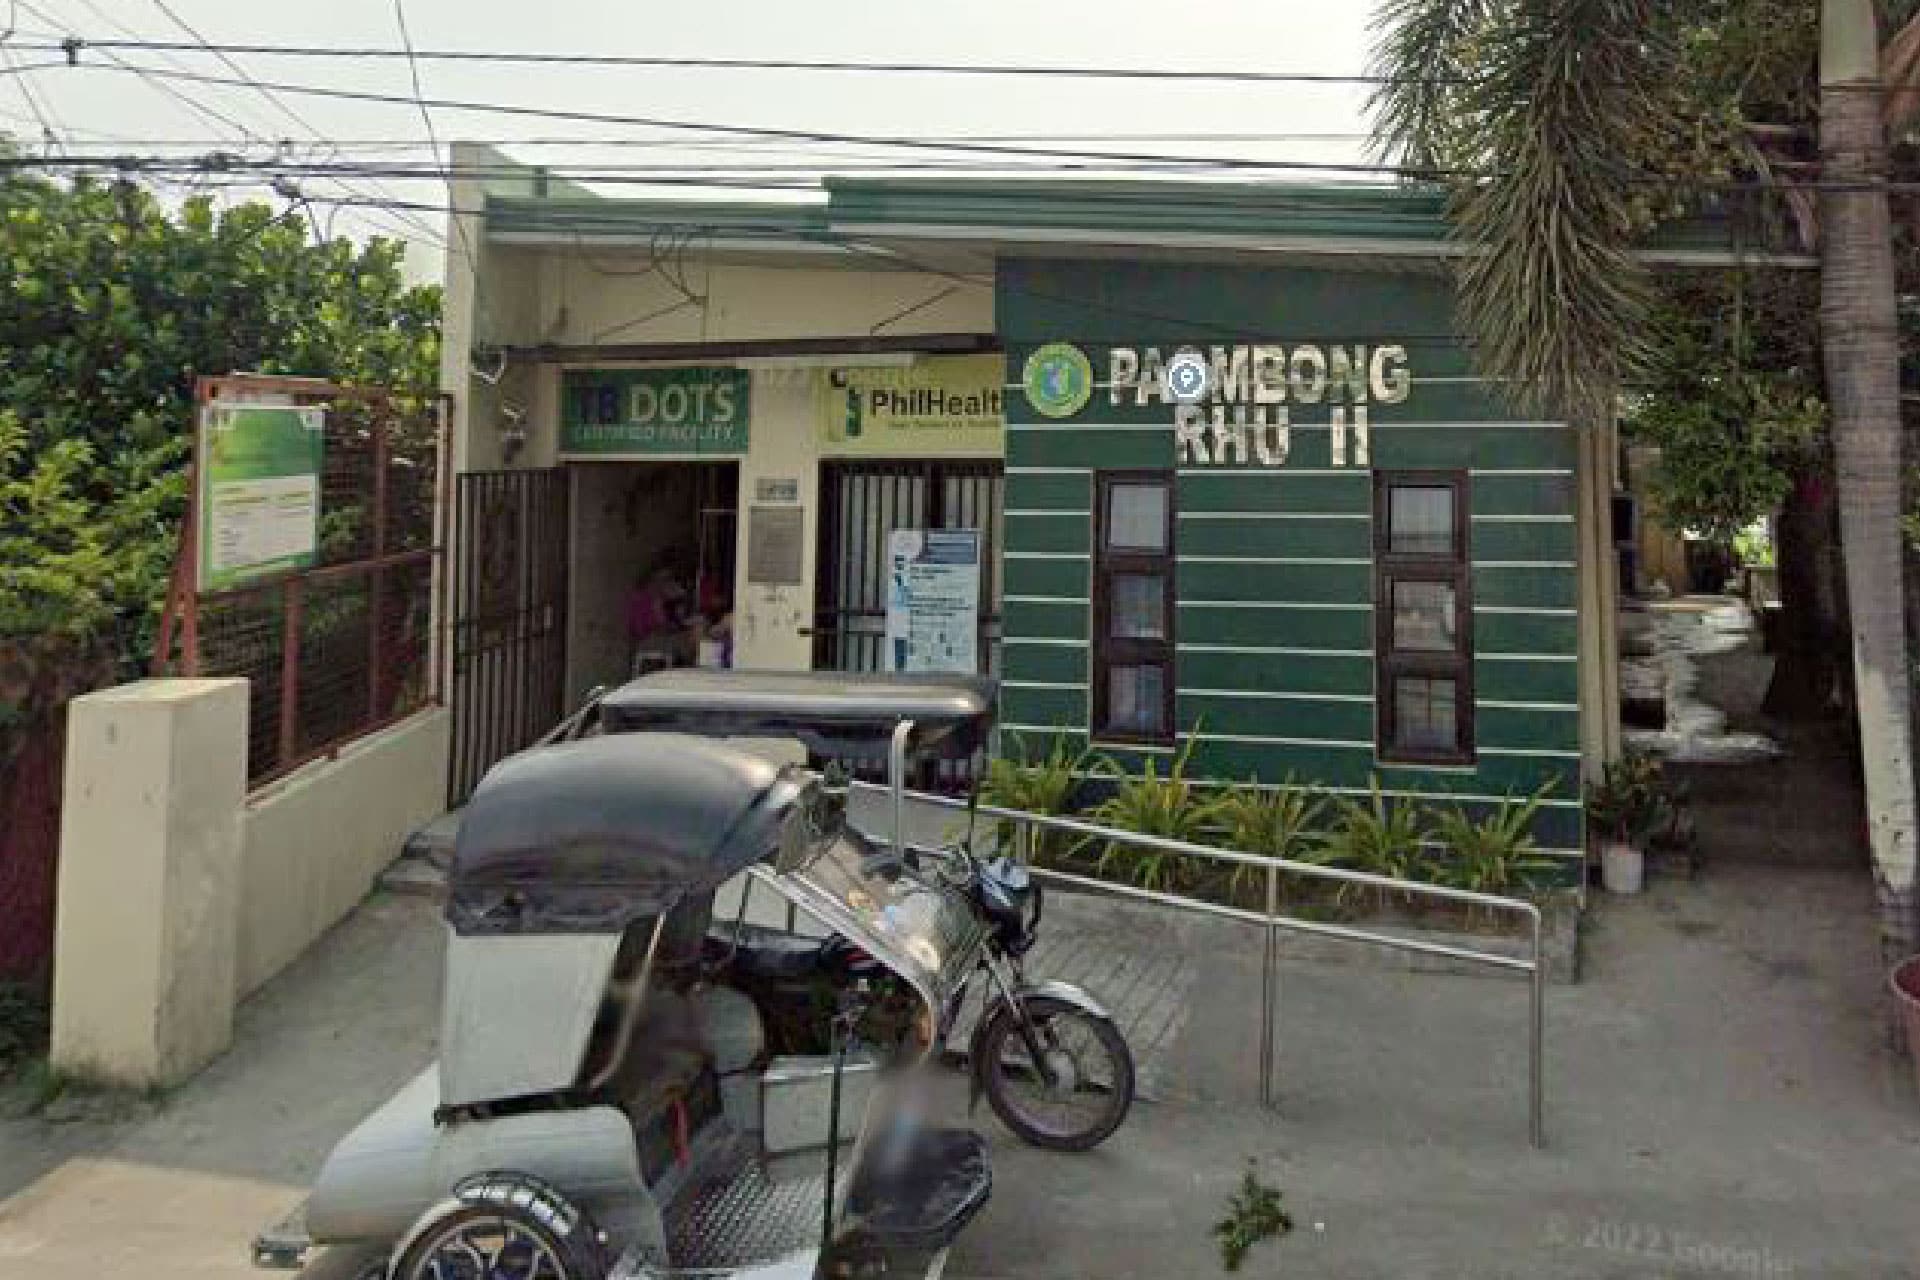
RHU 2
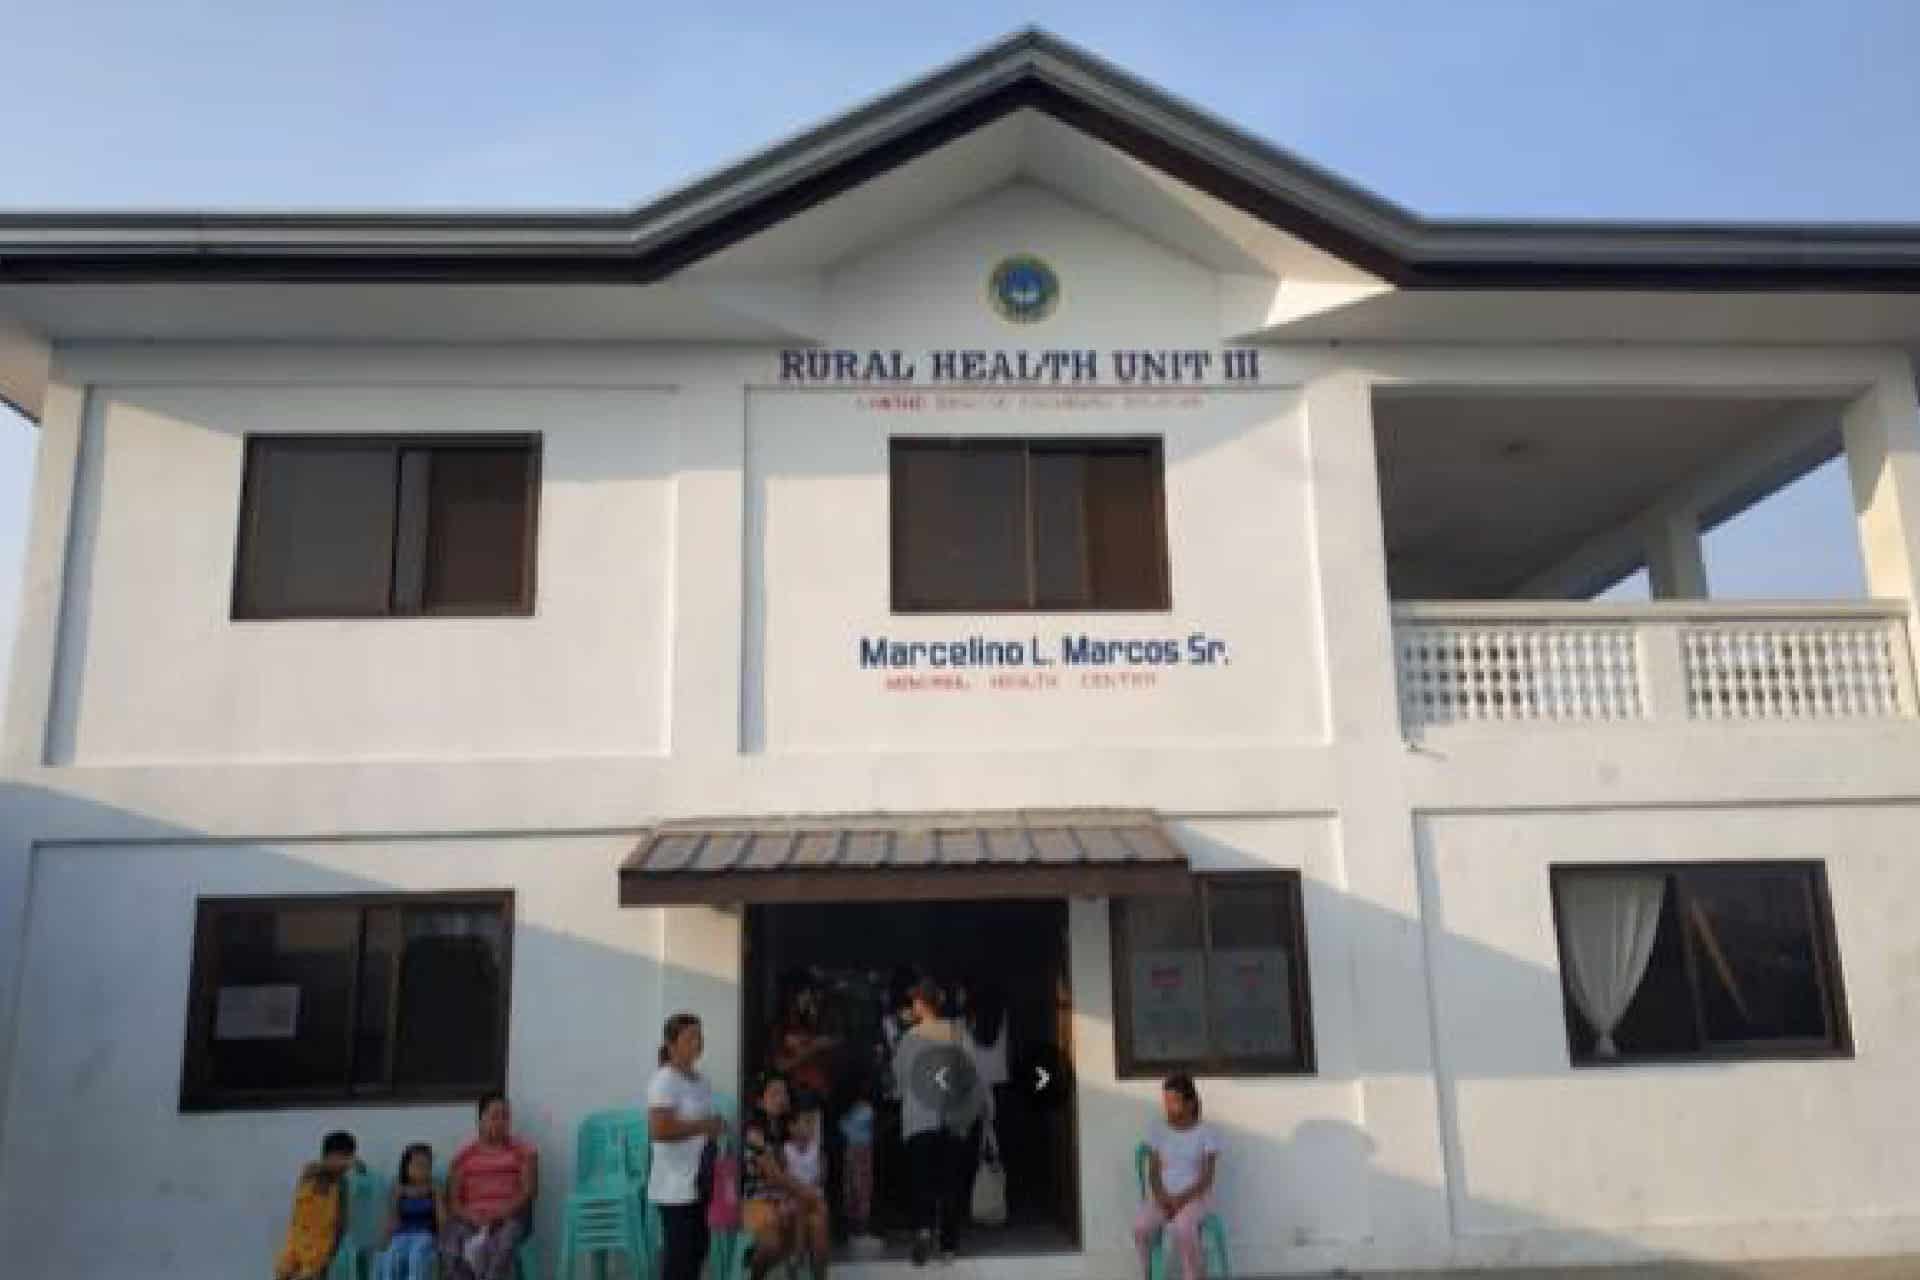
RHU 3